Stage
User Action
Manager needs to understand pipeline health — which deals are stalling, where reps need coaching
Manager contacts CSM requesting a report
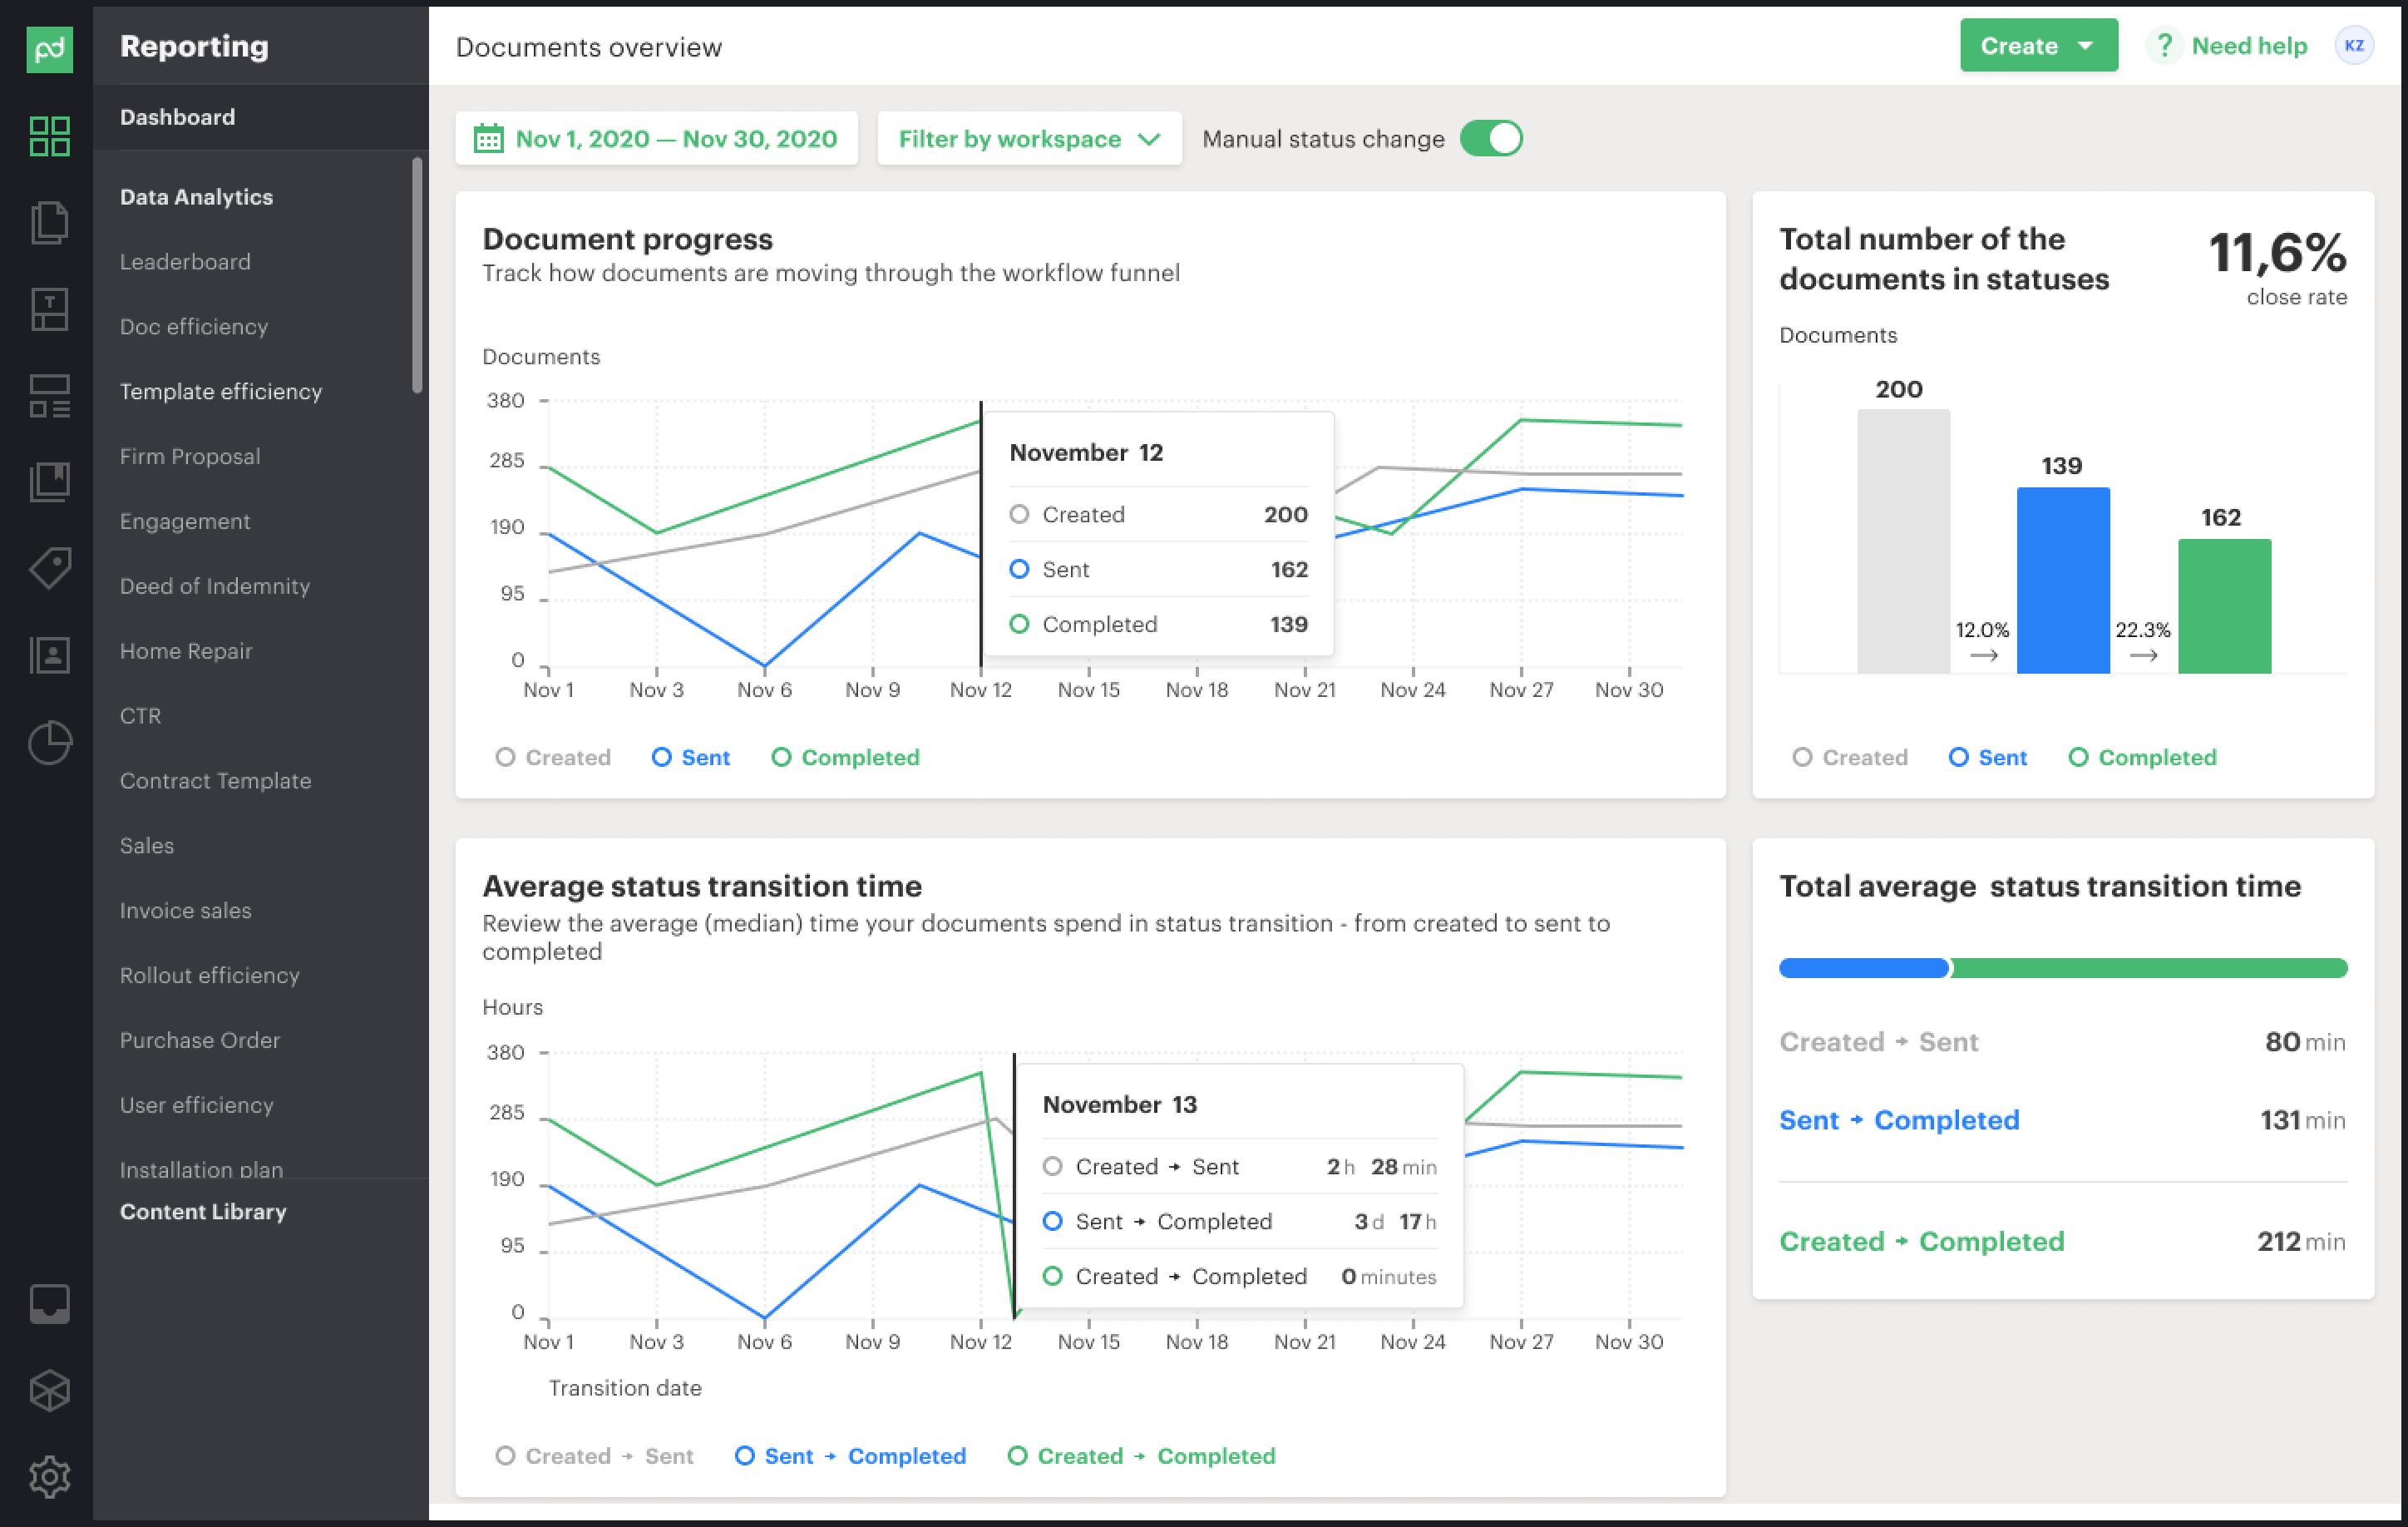
Manager navigates to the new Reporting tab
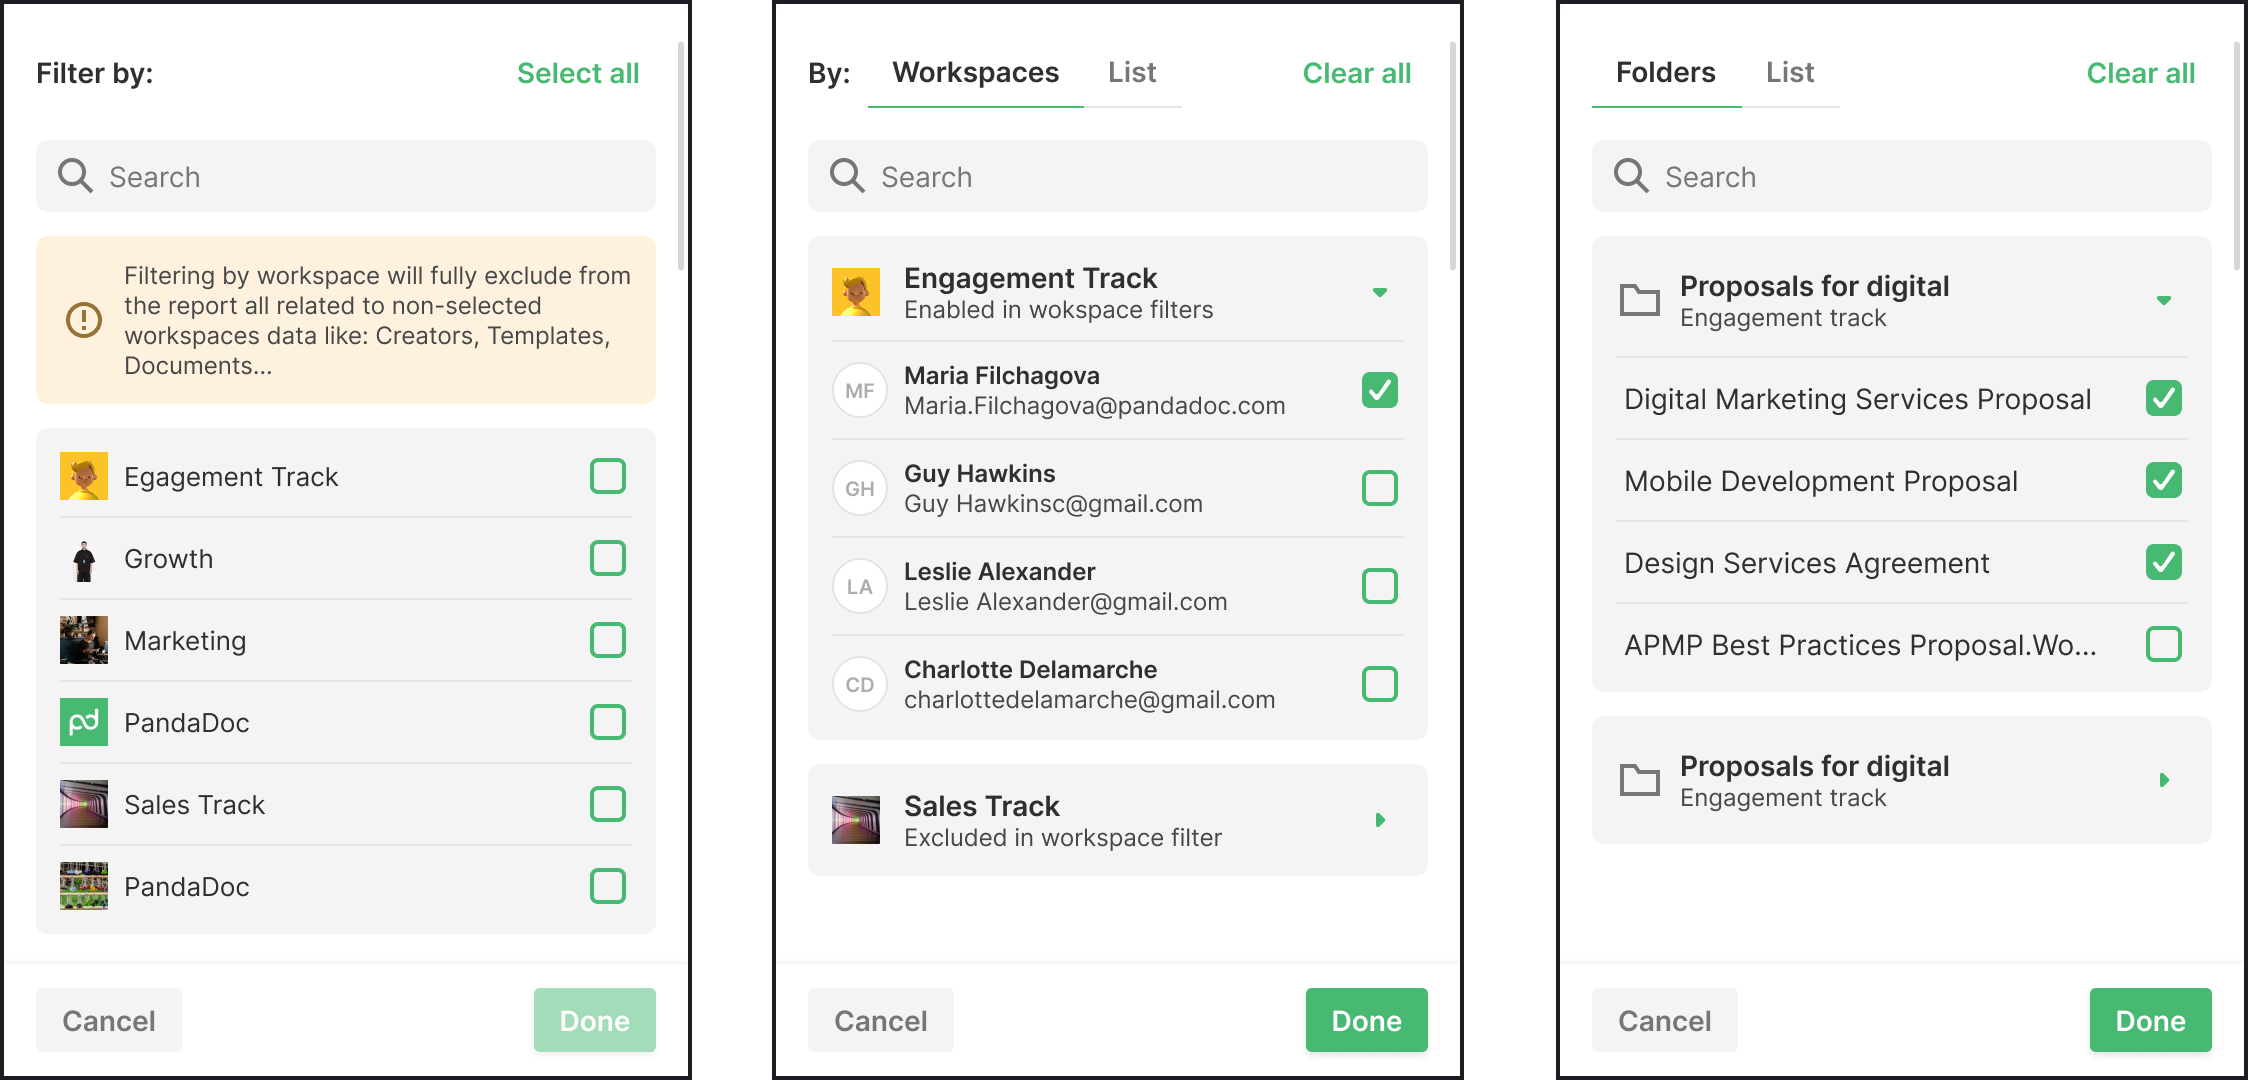
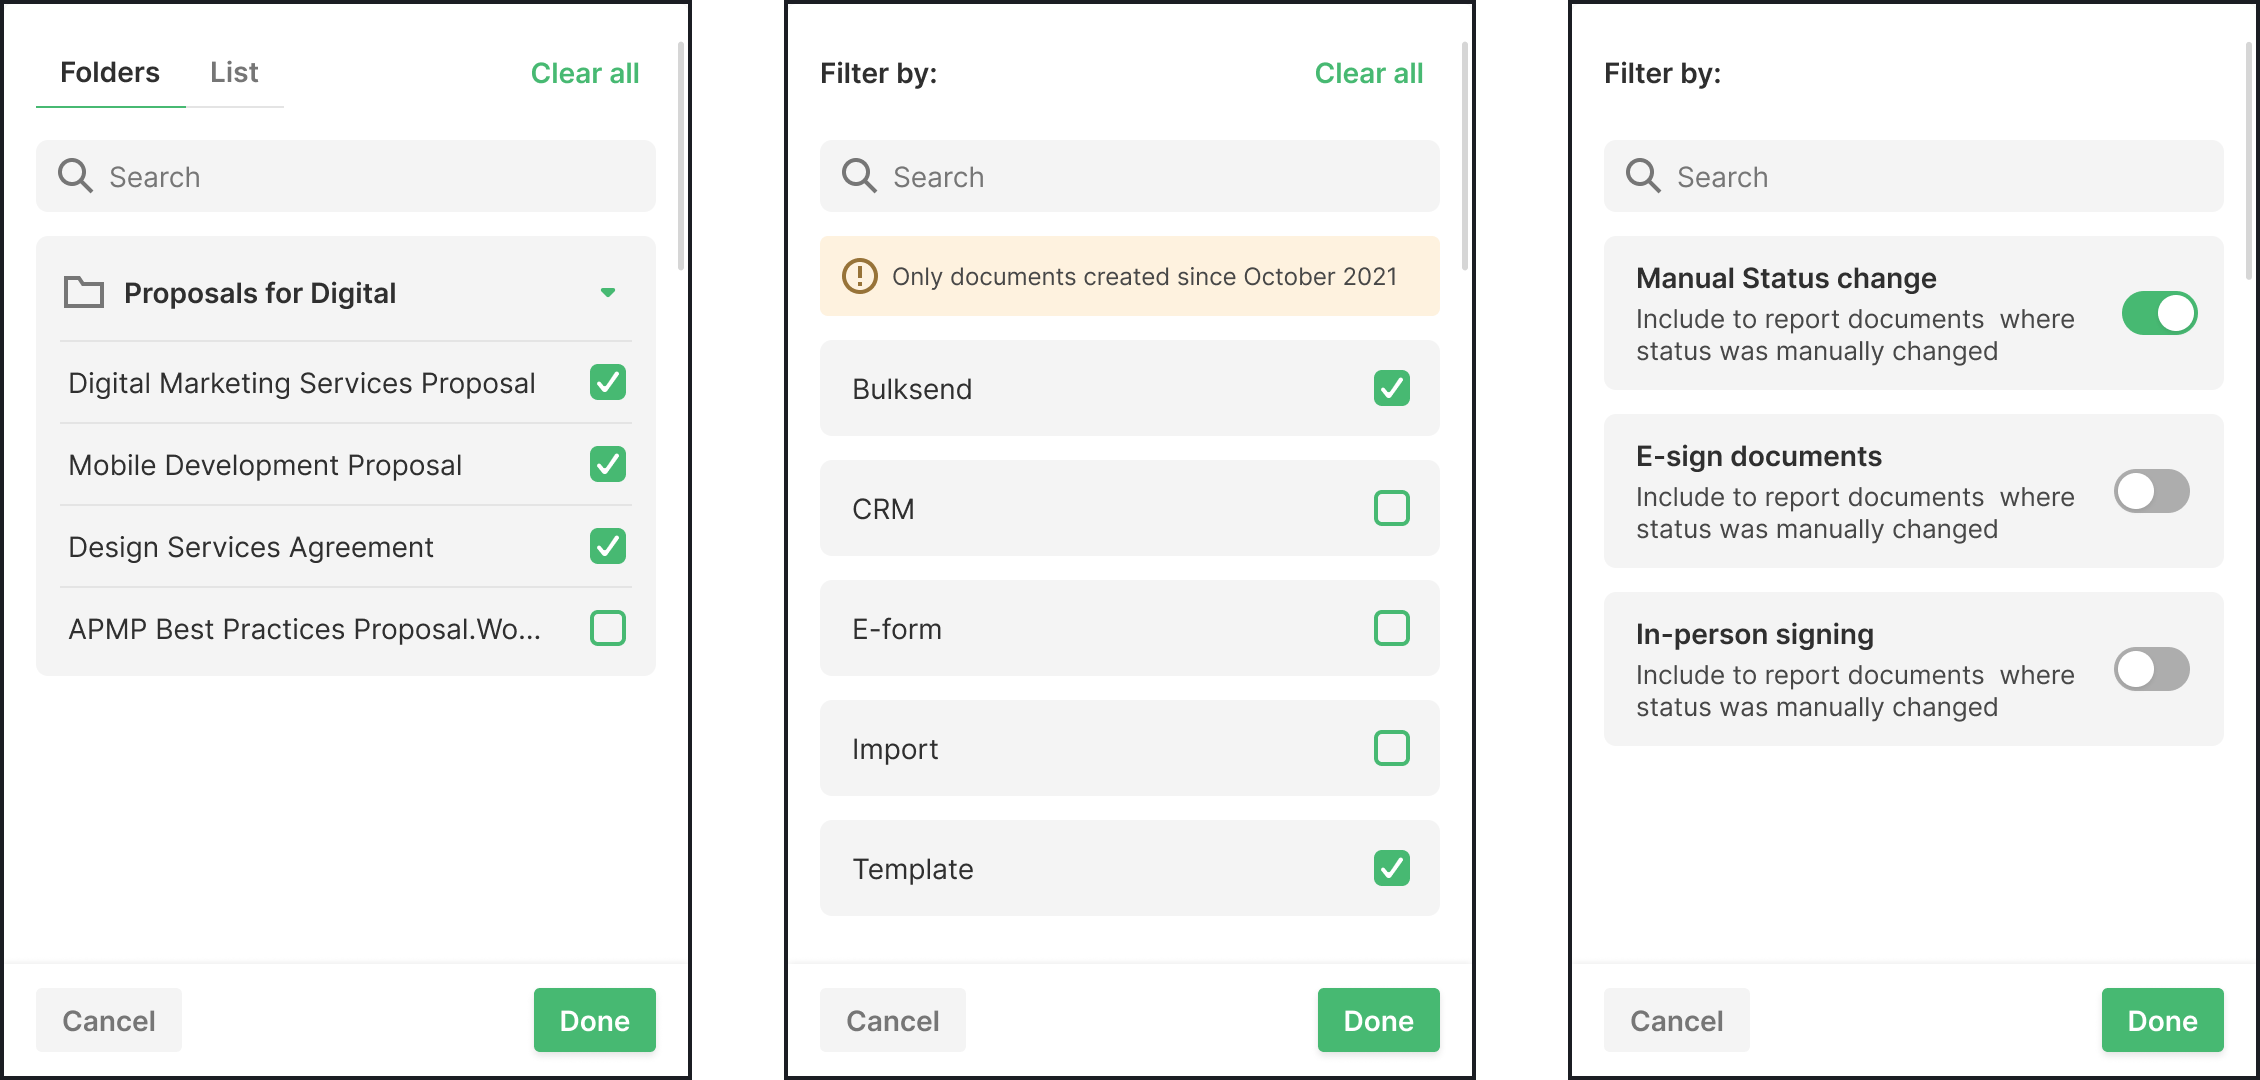
Manager tries to filter documents by sender, status, time period
Manager identifies that a specific rep's documents consistently stall at "viewed"
Emotion
Blocked
Resigned
Skeptical
Engaged
Empowered
Pain Point (Before)
No reporting in the product. To get any data, the business had to contact their CSM
CSM → PM → EM → dev resources → report produced. Multi-week delay for a single data pull
Initial design prioritized visual dashboard — would have been useless for managers who needed to manipulate data
No filtering, no grouping, no pivot — raw export only
This pattern was previously invisible — required a custom engineering report to surface
Design Response
Self-Service Reporting built to eliminate the CS dependency entirely
Feature removes the entire chain: manager gets data on demand
Research synthesis mid-project shifted primary focus from dashboard to data table with pivot capability
Table designed with show/hide columns, pivot tables, dynamic filters, horizontal scroll for 30+ data points
Filtered, grouped table view makes per-rep, per-status trends immediately visible